April 25th, 2021
Anime Data Blog 4
Review Calculations project
This project has been one of the longest and most frustrating to date.
I originally wanted a more in-depth way to compare studios than my previous project. Before, I just been looking at average membership and score per show, in addition to how many titles a studio had created. But that didn't exactly tell me in what specific ways each studio compared to each other, or how one might be better in some ways and weaker in others.
Though I've never used the feature myself, I realized how useful anime reviews could be for this. When someone reviews an anime, they can give individual scores to different aspects of the show - separating each of them out from the overall experience. If you average out all of the reviews for a particular show, you can get that anime's general strengths and weaknesses. For instance, maybe the animation and art style was really good, but the plot and characters weren't that interesting. Or maybe the story was really bad, but you actually enjoyed it despite that. If averages are particularly high or low, then a lot of people might have the same opinion, and it becomes characteristic of the show itself in a way.
Now suppose you go ahead and average out the reviews for all of the shows from a single studio. You might be able to see if there is a pattern or trend in the shows they create. Do they tend to have really good animation? A really good soundtrack? Do they make really well-written series or shows that a lot of people love to watch? Once you start to see a studio's strengths and weaknesses, you might be able to give yourself a good idea of what to expect when a new anime is announced. This is already happening to some degree, in fact. When it's announced that ufotable is handling a new anime, people already talk about how the animation is going to look absolutely incredible. When it's Kyoto Animation, people are expecting a really beautiful tear-jerker. And when it's Madhouse it's expected that it won't have a second season it's going to be a really hype adaptation.
So anyways, that's what I decided to do. But it was definitely easier said than done. Even calculating the average aspect score for a single show proved to be a real frustrating task. Take for example the reviews for Death Note. If you just look at the 'Overall' ratings, you get an average that's about 8.15. If you go through and calculate the average scores for it's Story, Animation, Sound, Characters, and Enjoyment, you get 7.45, 7.7, 7.45, 7.5, and 7.7 respectively. Those numbers aren't super helpful, and with a range of 0.25, imply that each aspect of Death Note was fairly average overall and compared with each other. Then I realized that I should probably give more weight to the top reviews. The top review has been rated helpful by 2000+ people, compared to the ones on the bottom that have maybe a dozen ratings. The more people agree with a particular review, the more weight should be given to the aspect scores, especially in cases where the scores are extremely high or low
So then I recalculated Death Note's review scores weighted by review, and got Story (8.51), Animation (8.76), Sound (8.77), Character (8.20), and Enjoyment (8.81). The aspect scores are much higher and the range is slightly larger as well (0.61). To be honest I don't know if those numbers are actually more accurate or not; the average aspect score is 8.61, which is a lot closer to Death Note's actual score of 8.63, but nothing says those numbers have to match up.
Regardless, I decided to use this method moving forward. Once I got the hang of calculating the reviews for a single show, it was easy enough to automate the process and data scrap the numbers - otherwise I would be stuck doing it manually (which by that point had resulted in multiple errors and wrong numbers). But the problem I ran into was trying to automate the entire thing, as in, calculating all of the average aspect scores for every single entry for a particular studio all at the same time. Not unexpectedly, the whole thing basically crashed and I had to give up. I managed to get 4 studios done, though - and it looks pretty neat.

Obviously the graph is a bit exaggerated: the axis is restricted in order to see the subtle differences between each studio. In reality each of the 4 studios I've looked at so far are all fairly well-rounded and don't have very pronounced strengths or weaknesses. It remains to be seen whether the same can be said of the rest of the studios.
Eventually I decided to pick the project back up...and didn't really do much with it. Each studio's rating is based on the most popular of its TV entries - so it's calculated from the shows that most people have watched. However, each specific show is given more weight based on its age, not popularity. My thinking is, I want a studio to be judged for it's most popular shows, but it should be more skewed towards how those shows have performed historically. I feel like that gives a better advantage to classics that would otherwise be looked over in favor of more recent anime. The only example I can think of where this problem is easy to see is with studio ufotable. Kimetsu no Yaiba (Demon Slayer) is currently ufotable's most popular title, surpassing the entirety of the Fate series, which up until now the studio was most known for. Even though ufotable is generally known for its stellar animation - which Demon Slayer does have plenty of - it's usually in reference to Fate (think Unlimited Budget Works). Because more and more people are watching anime every single season, I wanted to get rid of the unfair advantage due to that recency bias.
Automating the project is still a problem, and I'm left with 2 equally tedious options, either let the large data scraping run, and probably take hours to load, or have to run each individual entry one at a time. I don't mind tedious work as long as it doesn't get stuck, so I went with the latter option, and I was able to refine the data scrapping a bit to go a bit quicker. Hopefully I'll be able to post the final result eventually; it would be cool to have that kind of in-depth data on each of the major studios.
Anyways, thanks for reading.
Quorra
This project has been one of the longest and most frustrating to date.
I originally wanted a more in-depth way to compare studios than my previous project. Before, I just been looking at average membership and score per show, in addition to how many titles a studio had created. But that didn't exactly tell me in what specific ways each studio compared to each other, or how one might be better in some ways and weaker in others.
Though I've never used the feature myself, I realized how useful anime reviews could be for this. When someone reviews an anime, they can give individual scores to different aspects of the show - separating each of them out from the overall experience. If you average out all of the reviews for a particular show, you can get that anime's general strengths and weaknesses. For instance, maybe the animation and art style was really good, but the plot and characters weren't that interesting. Or maybe the story was really bad, but you actually enjoyed it despite that. If averages are particularly high or low, then a lot of people might have the same opinion, and it becomes characteristic of the show itself in a way.
Now suppose you go ahead and average out the reviews for all of the shows from a single studio. You might be able to see if there is a pattern or trend in the shows they create. Do they tend to have really good animation? A really good soundtrack? Do they make really well-written series or shows that a lot of people love to watch? Once you start to see a studio's strengths and weaknesses, you might be able to give yourself a good idea of what to expect when a new anime is announced. This is already happening to some degree, in fact. When it's announced that ufotable is handling a new anime, people already talk about how the animation is going to look absolutely incredible. When it's Kyoto Animation, people are expecting a really beautiful tear-jerker. And when it's Madhouse it's expected that it won't have a second season it's going to be a really hype adaptation.
So anyways, that's what I decided to do. But it was definitely easier said than done. Even calculating the average aspect score for a single show proved to be a real frustrating task. Take for example the reviews for Death Note. If you just look at the 'Overall' ratings, you get an average that's about 8.15. If you go through and calculate the average scores for it's Story, Animation, Sound, Characters, and Enjoyment, you get 7.45, 7.7, 7.45, 7.5, and 7.7 respectively. Those numbers aren't super helpful, and with a range of 0.25, imply that each aspect of Death Note was fairly average overall and compared with each other. Then I realized that I should probably give more weight to the top reviews. The top review has been rated helpful by 2000+ people, compared to the ones on the bottom that have maybe a dozen ratings. The more people agree with a particular review, the more weight should be given to the aspect scores, especially in cases where the scores are extremely high or low
So then I recalculated Death Note's review scores weighted by review, and got Story (8.51), Animation (8.76), Sound (8.77), Character (8.20), and Enjoyment (8.81). The aspect scores are much higher and the range is slightly larger as well (0.61). To be honest I don't know if those numbers are actually more accurate or not; the average aspect score is 8.61, which is a lot closer to Death Note's actual score of 8.63, but nothing says those numbers have to match up.
Regardless, I decided to use this method moving forward. Once I got the hang of calculating the reviews for a single show, it was easy enough to automate the process and data scrap the numbers - otherwise I would be stuck doing it manually (which by that point had resulted in multiple errors and wrong numbers). But the problem I ran into was trying to automate the entire thing, as in, calculating all of the average aspect scores for every single entry for a particular studio all at the same time. Not unexpectedly, the whole thing basically crashed and I had to give up. I managed to get 4 studios done, though - and it looks pretty neat.
Obviously the graph is a bit exaggerated: the axis is restricted in order to see the subtle differences between each studio. In reality each of the 4 studios I've looked at so far are all fairly well-rounded and don't have very pronounced strengths or weaknesses. It remains to be seen whether the same can be said of the rest of the studios.
Eventually I decided to pick the project back up...and didn't really do much with it. Each studio's rating is based on the most popular of its TV entries - so it's calculated from the shows that most people have watched. However, each specific show is given more weight based on its age, not popularity. My thinking is, I want a studio to be judged for it's most popular shows, but it should be more skewed towards how those shows have performed historically. I feel like that gives a better advantage to classics that would otherwise be looked over in favor of more recent anime. The only example I can think of where this problem is easy to see is with studio ufotable. Kimetsu no Yaiba (Demon Slayer) is currently ufotable's most popular title, surpassing the entirety of the Fate series, which up until now the studio was most known for. Even though ufotable is generally known for its stellar animation - which Demon Slayer does have plenty of - it's usually in reference to Fate (think Unlimited Budget Works). Because more and more people are watching anime every single season, I wanted to get rid of the unfair advantage due to that recency bias.
Automating the project is still a problem, and I'm left with 2 equally tedious options, either let the large data scraping run, and probably take hours to load, or have to run each individual entry one at a time. I don't mind tedious work as long as it doesn't get stuck, so I went with the latter option, and I was able to refine the data scrapping a bit to go a bit quicker. Hopefully I'll be able to post the final result eventually; it would be cool to have that kind of in-depth data on each of the major studios.
Anyways, thanks for reading.
Quorra
Posted by ISOQuorra | Apr 25, 2021 6:23 AM | 0 comments
March 30th, 2021
Data Update 1
Anime Relations: Death Note, Fullmetal Alchemist: Brotherhood, Sword Art Online, Shingeki no Kyojin, Nanatsu no Taizai, Shingeki no Kyojin Season 2, Boku no Hero Academia, Yuru Camp△ Season 2, Ex-Arm, Mushoku Tensei: Isekai Ittara Honki Dasu, Yakusoku no Neverland 2nd Season, Shingeki no Kyojin: The Final Season, Dr. Stone: Stone Wars, Re:Zero kara Hajimeru Isekai Seikatsu 2nd Season Part 2, Horimiya
A lot of my data projects require regular updates - the lengths between which range from as short as every day to as long as a year
Around the end of the winter season is when a lot of those updates coincide, so I thought I'd share what I found to be the most interesting when looking over the new data.
Seasonal & Studio Ranking
Finishing up the data for the Winter 2021 season, the results are...very interesting. To preface, I only track the existing shows that have at least 1,000 members as of the first day of the season (the first day of the month), so anything that only gains enough members after then or any new anime added to the page later on isn't tracked
The top 3 series that gained the most in membership over the course of the season were: Attack on Titan Final Season, which gained an additional 650,000 since day 1; Horimiya, that had about a 450,000 member growth - and the highest single day of growth (22,000); and Mushoku Tensei, which gained almost 400,000 during the season
The top 3 series that had the most popularity were: Attack on Titan Final Season (910,000); the Promised Neverland Season 2 (560,000), and Dr. Stone: Stone Wars (490,000)
The 3 anime with the highest average score: Attack on Titan Final Season (9.11), Re:Zero 2nd Season Part 2 (8.31), and Yuru Camp△ 2nd Season (8.13)
While I wouldn't normally feel the need to mention the lower-scoring shows, this season is kind of unique. Ex-Arm finishes with lowest score I've ever seen from an anime (2.74) and the lowest cumulative drop (-3.91). It was 2.12 at its lowest and was actually the lowest-ranking entry on MAL for a good while. Additionally, The Promised Neverland S2 has probably the most severe gradual decline I've seen from any airing anime to date. It's finishing at a very uncharacteristically low 6.06, a far drop from the fairly high 8.48 it had when it first started airing.

Overall, this season has been a very successful one. The average membership was nearly double that compared to the previous Fall season (160,000 vs 80,000) and they had the same number of airing shows. The average score was higher in comparison as well: 7.72 vs 7.49
Moving on to the studio rankings, I added 18 new studios to the chart, and am now tracking almost 100 different studios in total.
After updating the numbers, Madhouse is no longer the #1 studio. It falls just barely behind Production I.G due to the number of new shows it has been producing. But overall the top 5 remain the same
1. Production I.G
2. Madhouse
3. J.C.Staff
4. A-1 Pictures
5. Sunrise
Even looking at their weighted ranks - ignoring the number of shows for each studio - Madhouse and I.G. are tied in the #1 spot
1. Madhouse & Production I.G
3. Bones
4. A-1 Pictures
5. J.C.Staff

I think in the future I'm going to be making a version for Anime Licensors such as FUNimation, Crunchyroll, and Netflix to see how they all compare
Global Average Trends
Anime continues to get more and more popular as the years go by. I can't speak for it's mainstream status exactly, but it's not hard to see that there are more and more shows coming out each year. On average, there are around 30-50 new anime per season. Compare that to just a decade ago, which had a seasonal average ranging from 20 to 40 new series.
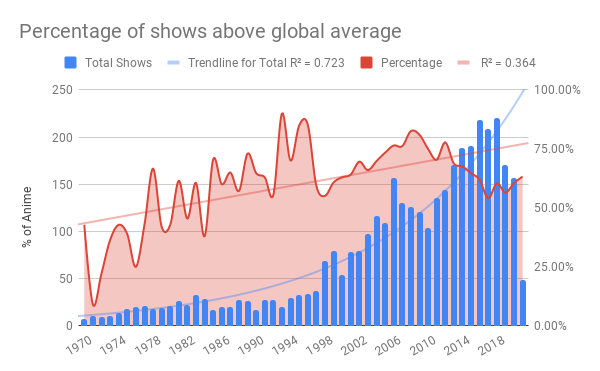
Whether because of this growing popularity - or in spite of it - there does seems to be a slight decline in score, with a smaller percentage of shows scoring above the mean score of the database. Perhaps this is just quantity over quality, but it is not a super significant trend. It remains to be seen whether the actual global mean will change anytime soon.
If we actually look at weighted average - that is, average score that takes popularity into account - there is a steadily increasing average score for seasonal anime, which I think is a pretty good sign.
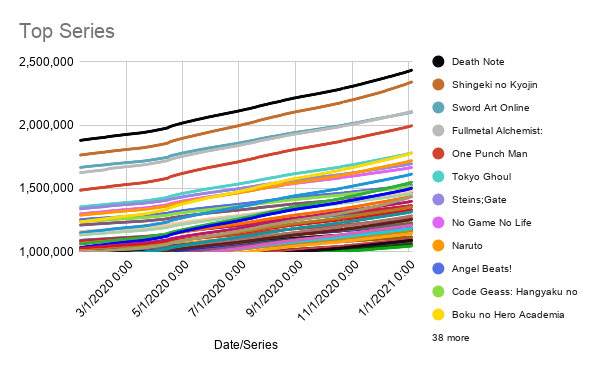
Top of the Year 2020
After tracking the top 50 shows on MAL for almost a year, I'm really proud of how the data ended up.
I'm very excited to see what new data I can collect this year!
Thanks for reading!
Quorra
Around the end of the winter season is when a lot of those updates coincide, so I thought I'd share what I found to be the most interesting when looking over the new data.
Seasonal & Studio Ranking
Finishing up the data for the Winter 2021 season, the results are...very interesting. To preface, I only track the existing shows that have at least 1,000 members as of the first day of the season (the first day of the month), so anything that only gains enough members after then or any new anime added to the page later on isn't tracked
The top 3 series that gained the most in membership over the course of the season were: Attack on Titan Final Season, which gained an additional 650,000 since day 1; Horimiya, that had about a 450,000 member growth - and the highest single day of growth (22,000); and Mushoku Tensei, which gained almost 400,000 during the season
The top 3 series that had the most popularity were: Attack on Titan Final Season (910,000); the Promised Neverland Season 2 (560,000), and Dr. Stone: Stone Wars (490,000)
The 3 anime with the highest average score: Attack on Titan Final Season (9.11), Re:Zero 2nd Season Part 2 (8.31), and Yuru Camp△ 2nd Season (8.13)
While I wouldn't normally feel the need to mention the lower-scoring shows, this season is kind of unique. Ex-Arm finishes with lowest score I've ever seen from an anime (2.74) and the lowest cumulative drop (-3.91). It was 2.12 at its lowest and was actually the lowest-ranking entry on MAL for a good while. Additionally, The Promised Neverland S2 has probably the most severe gradual decline I've seen from any airing anime to date. It's finishing at a very uncharacteristically low 6.06, a far drop from the fairly high 8.48 it had when it first started airing.
Overall, this season has been a very successful one. The average membership was nearly double that compared to the previous Fall season (160,000 vs 80,000) and they had the same number of airing shows. The average score was higher in comparison as well: 7.72 vs 7.49
Moving on to the studio rankings, I added 18 new studios to the chart, and am now tracking almost 100 different studios in total.
After updating the numbers, Madhouse is no longer the #1 studio. It falls just barely behind Production I.G due to the number of new shows it has been producing. But overall the top 5 remain the same
1. Production I.G
2. Madhouse
3. J.C.Staff
4. A-1 Pictures
5. Sunrise
Even looking at their weighted ranks - ignoring the number of shows for each studio - Madhouse and I.G. are tied in the #1 spot
1. Madhouse & Production I.G
3. Bones
4. A-1 Pictures
5. J.C.Staff
I think in the future I'm going to be making a version for Anime Licensors such as FUNimation, Crunchyroll, and Netflix to see how they all compare
Global Average Trends
Anime continues to get more and more popular as the years go by. I can't speak for it's mainstream status exactly, but it's not hard to see that there are more and more shows coming out each year. On average, there are around 30-50 new anime per season. Compare that to just a decade ago, which had a seasonal average ranging from 20 to 40 new series.
Whether because of this growing popularity - or in spite of it - there does seems to be a slight decline in score, with a smaller percentage of shows scoring above the mean score of the database. Perhaps this is just quantity over quality, but it is not a super significant trend. It remains to be seen whether the actual global mean will change anytime soon.
If we actually look at weighted average - that is, average score that takes popularity into account - there is a steadily increasing average score for seasonal anime, which I think is a pretty good sign.
Top of the Year 2020
After tracking the top 50 shows on MAL for almost a year, I'm really proud of how the data ended up.
- FMAB passed SAO for the #3 spot
- My Hero Academia made it into the top 10, finishing at #7
- Attack on Titan S2 and The Seven Deadly Sins increased the most in popularity, both jumping 12 spots by the end of the year
- At the beginning, just about half of the top 50 already had 1M members; by the end of the year, the remaining 24 reached 1M, with the top 4 even reaching 2M members!
- The top 3 shows with the highest average daily growth were: Attack on Titan (1,600); Death Note (1,500); and My Hero Academia (1,500)
I'm very excited to see what new data I can collect this year!
Thanks for reading!
Quorra
Posted by ISOQuorra | Mar 30, 2021 4:21 PM | 0 comments
March 18th, 2021
Anime Data Blog 3
Anime Relations: Monster, Kidou Senshi Gundam, Hunter x Hunter, Dragon Ball, Hajime no Ippo, Death Note, Fairy Tail, Ao no Exorcist, Sword Art Online, Shigatsu wa Kimi no Uso, Nanatsu no Taizai, One Punch Man, Boku dake ga Inai Machi
MAL Top 500 project
The most ambitious project I had at the time (before I learned how to data scrap) was seeing if there was any correlation between rank and popularity on MAL. Me and a friend had this hypothesis that there were certain clusters of years where there was a lot of good anime coming out. Either it was just coincidence or there was actually a pattern to figure out.
We went through MAL's top series, page-by-page, for several hours. I wanted to make sure my sample size was large enough, so we went through the first 500 entries. I put them in a list according to release date. And then we did the same thing for the top popular series. It was exhausting.
And ultimately, inconclusive.
The end result looks something like the graph of >6.58 series from earlier. Just a very spread out distribution of points with a peak trailing about 2-3 years from the current.
While it does seem like there are certain seasons for which it's more likely to have good anime coming out, it doesn't appear that there is any particular 'best' year for anime in general. Just that the most popular and highest-scoring series are likely to always be less than a decade old.
I've thought about maybe in a future project to look at the actual scores and membership totals for specific years, but that might have to be done at a later time.
Studio Statistics project
In contrast to my top 500 project, this is probably one of my most extensive efforts to collect and compare relevant data. One of the main features I enjoy using on MALGraph is the option to see average scores for different types of things: anime lengths, genres, release years, etc. One of the more interesting ones is average score for genres and studios. It allows you to see a) how many shows you have seen with a specific genre (or made by a specific studio), b) what your average score is for that genre or studio, and c) how much time you have spent watching that genre or anime from that studio.
While it's cool enough just to look at the breakdown for your own profile (or other individual users), I wanted to see if I could scale it up to the entire site - specifically the studio statistics. By this point, I had learned how to data scrap, so without the limitation of needing to input everything in manually, I could pretty much do everything I needed to to make this project work.
I started with the top 50 studios plus a handful more. The easiest thing to start with was writing down how many series they had produced so far (since that is nicely indicated right on the page). No surprise Toei was (and still is), the largest studio series-wise (700+) - which makes sense since they have both One Piece and Dragon Ball. Sunrise follows with almost 500 entries - which also makes sense because...Gundam. There are any number of studios with only a single title released, so I made the lower limit 10. The smallest studio was originally Connect (11), but I later added Geno Studio (8).
What was more fun to do was getting the average membership and score data for the studios, which was as simple as averaging the membership and mean scores for all of their respective series. Turns out that A-1 Pictures is the most popular studio, averaging about 263,000 members per show. They did a lot of popular series (SAO, Your Lie in April, Seven Deadly Sins, Blue Exorcist, Erased, Fairy Tail, etc.) so I'm not surprised. Madhouse is just barely behind at 260,000 members average per show. The lowest average is Mushi Production, with 1,981 members per show.
Average score was pretty interesting to look at as well. Madhouse is actually #1 here, with ~7.89 per show (Death Note, Monster, Hunter x Hunter, Hajime no Ippo). Though I.G. Production is right next to it with ~7.88, so that might change pretty soon.
If you had to crown a #1 anime studio, it turns out to be Madhouse. Already first in average score and second in membership, it's fourth in size as well (369) above the ~110 average for all studios. Taking into account all 3 areas, the full list of the top 10 studios is:
Just for fun, I wanted to see if any of the information would look cool in a visual form. So I plotted Rank & Average members to see if there was any significant correlation. It's not a super strong correlation, but it still looks neat.

All in all, this has been one of my most fun projects to date, and I hope to expand it more in the future.
Thanks for reading!
Quorra
The most ambitious project I had at the time (before I learned how to data scrap) was seeing if there was any correlation between rank and popularity on MAL. Me and a friend had this hypothesis that there were certain clusters of years where there was a lot of good anime coming out. Either it was just coincidence or there was actually a pattern to figure out.
We went through MAL's top series, page-by-page, for several hours. I wanted to make sure my sample size was large enough, so we went through the first 500 entries. I put them in a list according to release date. And then we did the same thing for the top popular series. It was exhausting.
And ultimately, inconclusive.
The end result looks something like the graph of >6.58 series from earlier. Just a very spread out distribution of points with a peak trailing about 2-3 years from the current.
While it does seem like there are certain seasons for which it's more likely to have good anime coming out, it doesn't appear that there is any particular 'best' year for anime in general. Just that the most popular and highest-scoring series are likely to always be less than a decade old.
I've thought about maybe in a future project to look at the actual scores and membership totals for specific years, but that might have to be done at a later time.
Studio Statistics project
In contrast to my top 500 project, this is probably one of my most extensive efforts to collect and compare relevant data. One of the main features I enjoy using on MALGraph is the option to see average scores for different types of things: anime lengths, genres, release years, etc. One of the more interesting ones is average score for genres and studios. It allows you to see a) how many shows you have seen with a specific genre (or made by a specific studio), b) what your average score is for that genre or studio, and c) how much time you have spent watching that genre or anime from that studio.
While it's cool enough just to look at the breakdown for your own profile (or other individual users), I wanted to see if I could scale it up to the entire site - specifically the studio statistics. By this point, I had learned how to data scrap, so without the limitation of needing to input everything in manually, I could pretty much do everything I needed to to make this project work.
I started with the top 50 studios plus a handful more. The easiest thing to start with was writing down how many series they had produced so far (since that is nicely indicated right on the page). No surprise Toei was (and still is), the largest studio series-wise (700+) - which makes sense since they have both One Piece and Dragon Ball. Sunrise follows with almost 500 entries - which also makes sense because...Gundam. There are any number of studios with only a single title released, so I made the lower limit 10. The smallest studio was originally Connect (11), but I later added Geno Studio (8).
What was more fun to do was getting the average membership and score data for the studios, which was as simple as averaging the membership and mean scores for all of their respective series. Turns out that A-1 Pictures is the most popular studio, averaging about 263,000 members per show. They did a lot of popular series (SAO, Your Lie in April, Seven Deadly Sins, Blue Exorcist, Erased, Fairy Tail, etc.) so I'm not surprised. Madhouse is just barely behind at 260,000 members average per show. The lowest average is Mushi Production, with 1,981 members per show.
Average score was pretty interesting to look at as well. Madhouse is actually #1 here, with ~7.89 per show (Death Note, Monster, Hunter x Hunter, Hajime no Ippo). Though I.G. Production is right next to it with ~7.88, so that might change pretty soon.
If you had to crown a #1 anime studio, it turns out to be Madhouse. Already first in average score and second in membership, it's fourth in size as well (369) above the ~110 average for all studios. Taking into account all 3 areas, the full list of the top 10 studios is:
- Madhouse
- Production I.G.
- J.C. Staff
- A-1 Pictures
- Sunrise
- Bones
- Studio Deen
- Studio Pierrot
- Toei Animation
- Kyoto Animation
Just for fun, I wanted to see if any of the information would look cool in a visual form. So I plotted Rank & Average members to see if there was any significant correlation. It's not a super strong correlation, but it still looks neat.
All in all, this has been one of my most fun projects to date, and I hope to expand it more in the future.
Thanks for reading!
Quorra
Posted by ISOQuorra | Mar 18, 2021 10:49 PM | 0 comments
November 19th, 2020
Anime Data Blog 2
Anime Relations: Fate/stay night, Ouran Koukou Host Club, Zero no Tsukaima, Death Note, Code Geass: Hangyaku no Lelouch, Angel Beats!, Durarara!!, Highschool of the Dead, Ore no Imouto ga Konnani Kawaii Wake ga Nai
One of the first major projects I wanted to do was to look at the trends of seasonal anime on MAL.
"Is anime getting better?" is the question that I wanted to try and answer.
I decided to use average score as a baseline to start, so I would be looking at and comparing scores across periods of anime release to see if they were improving or declining.
Even without doing much research, my assumption was to say that there was a general increase in the quality of shows, given the medium's increase in popularity and prevalence in mainstream media. But popularity does equate to quality, and so it might turn out to be that anime is being watched and appreciated more in certain cultures, but is overall staying about the same in terms of quality.
Additionally, given the development of better animation and more funding for anime studios, it could also be more accurate to say that there are better individual shows coming out currently, but overall the quality has stayed the same.
Of course, it is also important to note that MyAnimeList has a predominantly Western community, and any information collected about trends or patterns cannot reliably be applied to populations outside of the demographic makeup of its users.
On MALGraph, the mean score across the entire database of MAL is ~6.58. [This value can change over time and will likely be different when looked at again but it has always stayed around this value, fluctuating by only a few hundredths]. With all this in mind, I went through MAL's seasonal archives to collect my data, which was as simple as counting how many shows met or exceeded that average score, keeping track of the number per season and totaling for the year.
The end result looks like this:
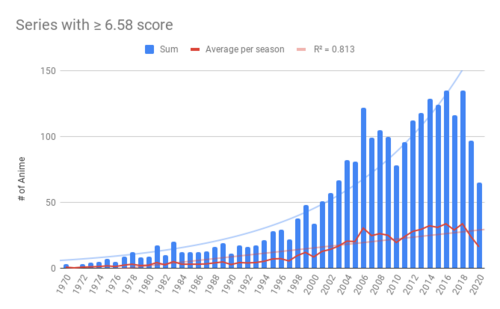
While this specific graph doesn't show the breakdown by season, it does clearly display the increase in the number of shows above the global mean, only declining for the recent years whose shows have not yet concluded or have yet to have significant impact due to their relatively short age. It has since been updated every year, to account both for the change in the global average as well as the continued release of more shows every season.
Interesting things to note: 2006 and 2010 seem to be outliers to the general trend, with 2006 being unusually saturated with high-scoring shows and 2010 being the opposite. For context, the most popular anime of 2006 (going in order of season) are: Fate/stay night, Ouran Highschool Host Club, The Familiar of Zero, Death Note, and Code Geass to name the most popular ones - the latter 2 being among the top ranked series and having 1M+ members as of writing.
In comparison, the most popular shows of 2010 are: Durarara!!, Angel Beats!, Highschool of the Dead, and OreImo.
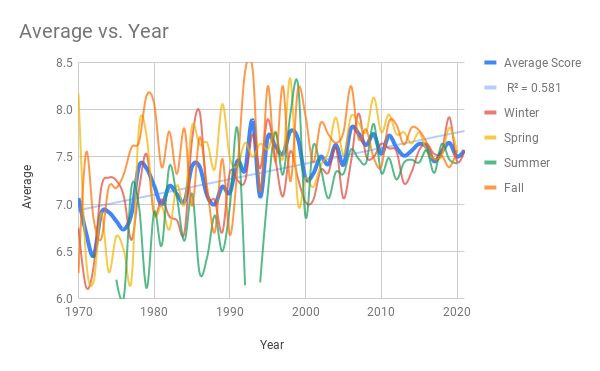
Wanting to see if there was a trend for specific seasons, I averaged the total per season and was able to see the data like this:

Descriptively, it appears that Spring and Fall have on average more shows with high scores than Winter & Summer. As of writing this I still don't have a good idea why, or whether this is actually statistically significant.
"Is anime getting better?" is the question that I wanted to try and answer.
I decided to use average score as a baseline to start, so I would be looking at and comparing scores across periods of anime release to see if they were improving or declining.
My initial theory was that there would be a general trend of average scores increasing over time.
Even without doing much research, my assumption was to say that there was a general increase in the quality of shows, given the medium's increase in popularity and prevalence in mainstream media. But popularity does equate to quality, and so it might turn out to be that anime is being watched and appreciated more in certain cultures, but is overall staying about the same in terms of quality.
Additionally, given the development of better animation and more funding for anime studios, it could also be more accurate to say that there are better individual shows coming out currently, but overall the quality has stayed the same.
Of course, it is also important to note that MyAnimeList has a predominantly Western community, and any information collected about trends or patterns cannot reliably be applied to populations outside of the demographic makeup of its users.
On MALGraph, the mean score across the entire database of MAL is ~6.58. [This value can change over time and will likely be different when looked at again but it has always stayed around this value, fluctuating by only a few hundredths]. With all this in mind, I went through MAL's seasonal archives to collect my data, which was as simple as counting how many shows met or exceeded that average score, keeping track of the number per season and totaling for the year.
The end result looks like this:
While this specific graph doesn't show the breakdown by season, it does clearly display the increase in the number of shows above the global mean, only declining for the recent years whose shows have not yet concluded or have yet to have significant impact due to their relatively short age. It has since been updated every year, to account both for the change in the global average as well as the continued release of more shows every season.
Interesting things to note: 2006 and 2010 seem to be outliers to the general trend, with 2006 being unusually saturated with high-scoring shows and 2010 being the opposite. For context, the most popular anime of 2006 (going in order of season) are: Fate/stay night, Ouran Highschool Host Club, The Familiar of Zero, Death Note, and Code Geass to name the most popular ones - the latter 2 being among the top ranked series and having 1M+ members as of writing.
In comparison, the most popular shows of 2010 are: Durarara!!, Angel Beats!, Highschool of the Dead, and OreImo.
Wanting to see if there was a trend for specific seasons, I averaged the total per season and was able to see the data like this:
Descriptively, it appears that Spring and Fall have on average more shows with high scores than Winter & Summer. As of writing this I still don't have a good idea why, or whether this is actually statistically significant.
Posted by ISOQuorra | Nov 19, 2020 2:53 PM | 0 comments
November 11th, 2020
Anime Data Blog 1
This is for all the data nerds in the community. I couldn't find a club and didn't know how to make one myself so I just decided I'd start a blog instead. I don't know if anyone else will find this very interesting but I thought I'd start write about the data collection I've done over the past few years and my opinions on the general trend of anime in the future. I think it would be a real cool thing to write down to look back on in the future.
Here's a little bit about me: I'm currently a senior in college hoping to study quantitative statistics (hence the data collection). My top 3 favorite anime are Attack on Titan, Soukyuu no Fafner, and Ghost in the Shell, and I've been watching anime for about 5 years now. A couple years ago I thought it would be interesting to take a closer look at all of the information on the MAL database to see if there were any cool patterns or trends I could identify. I've had a lot of fun with it and the number and complexity of the projects I'm working on has only increased as the years went by.
The majority of my data is just looking at scores and membership data in a variety of contexts and categories. Some of my larger projects involve looking at and tracking seasonal data over months or years. I make and maintain a lot of spreadsheets for this purpose, as it helps to input the data and also display it graphically for easier visibility.
Occasionally I might use Google Forms if it's something that requires community input, but I rarely build up the courage to put something like that out in the public.
I'm hoping to use the data I've collected in some useful way, either benefiting other users or the community at large.
Data Projects
I'll just start by listing all of my past and present projects, including ones that I've ended as well as the ones I'm currently still working on, along with brief descriptions of each. These are all approximately in order of when I first started them.
Thanks for reading!
Quorra
Here's a little bit about me: I'm currently a senior in college hoping to study quantitative statistics (hence the data collection). My top 3 favorite anime are Attack on Titan, Soukyuu no Fafner, and Ghost in the Shell, and I've been watching anime for about 5 years now. A couple years ago I thought it would be interesting to take a closer look at all of the information on the MAL database to see if there were any cool patterns or trends I could identify. I've had a lot of fun with it and the number and complexity of the projects I'm working on has only increased as the years went by.
The majority of my data is just looking at scores and membership data in a variety of contexts and categories. Some of my larger projects involve looking at and tracking seasonal data over months or years. I make and maintain a lot of spreadsheets for this purpose, as it helps to input the data and also display it graphically for easier visibility.
Occasionally I might use Google Forms if it's something that requires community input, but I rarely build up the courage to put something like that out in the public.
I'm hoping to use the data I've collected in some useful way, either benefiting other users or the community at large.
Data Projects
I'll just start by listing all of my past and present projects, including ones that I've ended as well as the ones I'm currently still working on, along with brief descriptions of each. These are all approximately in order of when I first started them.
- October 2018 - 'Prediction Sheet'
A project I made because I wanted to know how my mean score differed from the average mean score of all the shows I've watched until now. Used mostly in comparison to the mean score on MALGraph.
- October 2018 - 'Priority System'
Based on the overly-complicated way I tag entries on my list, this helps me organize and keep track of all of them. I also use it to help plan out what shows I want to watch in the future.
- December 2018 - 'Selection List'
This is one of my personal projects that helps me decide what I'm going to watch next based on what series are on my PTW that year.
- February 2019 - 'Prediction Sheet (MAL)'
Based on the one that I made for my own Completed, I looked at seasonal data from the past 50 years to see if there were any trends in the quantity and quality of shows coming out.
- March 2019 - 'MAL 500' [Discontinued]
Based on a hypothesis that a) series that were high in popularity were likely to also be high in score, and b) specific years within the past 2 decades might have an unusual amount of these 'high-quality' series. It has since been dissolved into a number of smaller projects.
- May 2019 - 'Studio Statistics'
This project looks at the largest studios and compares the combined statistics for all of their shows in order to get an idea of the top studios for anime production.
- June 2019 - Seasonal Data
I was curious about the day-to-day changes in the stats of seasonal anime (membership and scores) and decided to track them daily. I've now done this every season since Summer 2019.
- July 2019 - 'Review Calculations'
A project to look at the quality of different aspects of shows based on its top reviews to see how much people agreed on the specific characteristics of an anime.
- November 2019 - 'Score Sheet'
Based on the earlier Prediction Sheet for MAL, I looked at seasonal data (specifically scores) from the past 50 years to see if there are any patterns in the quality of shows coming out comparatively.
- December 2019 - 'Rating Curve' [Discontinued]
An attempt to see what the distribution of ratings - not scores - within my own completed list was.
- December 2019 - Anime Quizzes
One of the few community-oriented projects of mine. I turned the cover art for different anime into minimalist pallets and people guess which series they are.
- December 2019 - 'MAL Secret Santa' [Discontinued]
A project I made to help give better recommendations to people based on shared interests and genre statistics from MALGraph.
- January 2020 - 'Top 50 Tracking'
After a whole year of tracking seasonal data I was very interested to see if there would be any trends among the most popular shows on the database - anime with much higher membership counts and day-to-day fluctuations.
- May 2020 - 'MAL History Speed'
A calculator I made to see how fast someone watches anime based off of their recent history. I made it mostly for fun, and it doesn't have much purpose.
- June 2020 - 'Seasonal Summary Data'
I made this in order to organize and highlight the most important aspects of each season from all of the seasonal data collected.
- September 2020 - Top Upcoming Data [discontinued]
Based on the data tracking for the top 50 most popular series, I wanted to see how the membership stats looked for the top 50 upcoming series over the span of a season and what people were most excited for.
- September 2020 - 'Studio Calculations'
A project based on the earlier one for Review Calculations, now extended to all shows for a specific studio in order to get an idea of the strengths and weaknesses it has.
- October 2020 - 'Archive Statistics'
One of the largest ongoing projects I have to look at the breakdown of 'watch status' statistics (CMPL, CW, PTW, etc.) per show per season as far back as MAL's archives go.
- October 2020 - 'Statistics Test'
A small part of the large calculation sheet I use to update my seasonal data. Used to look at the stats for a single entry from MAL.
Thanks for reading!
Quorra
Posted by ISOQuorra | Nov 11, 2020 2:46 AM | 0 comments